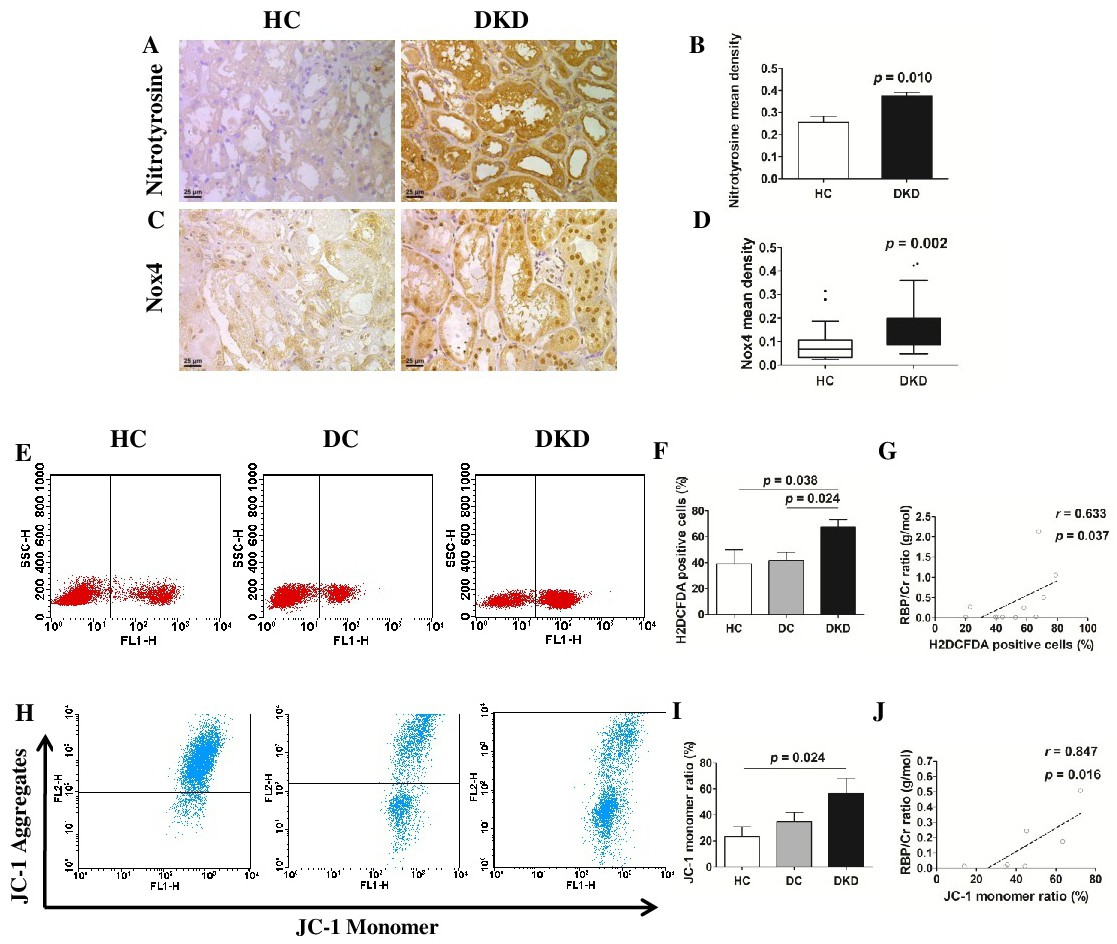
Fig. 4. ROS production was enhanced and mitochondrial membrane potential was decreased in proximal tubules and PBMCs of DKDs. (A-D) Expression of nitrotyrosine and Nox4 were both significantly up-regulated in renal tubules in DKDs compared to HCs. ×400 magnification. (E, F, H and I) Flow cytometric analysis showed overproduction of ROS and loss of mitochondrial membrane potential (ΔΨm) in PBMCs from DKDs (ROS, n=4; ΔΨm, n=3) compared to HCs (ROS, n=3; ΔΨm, n=5) and DCs (ROS, n=7; ΔΨm, n=4). (G and J) Correlation analysis revealed ROS production and loss of ΔΨm was positively correlated with RBP /Cr ratio, respectively. r, correlation coefficient; RBP, retinol-binding protein; Cr, creatinine; HC, healthy control; DC, diabetic control; DKD, diabetic kidney disease.